Wouldn’t it be amazing if the Teacher Tapp panel perfectly reflected the teacher population as a whole? Then your responses would straightforwardly tell us exactly what all teachers were thinking!
We are lucky in England that the School Workforce Census tells us what the population of teachers looks like (albeit just in state-funded schools). Our panellists are currently a little different in the following ways.
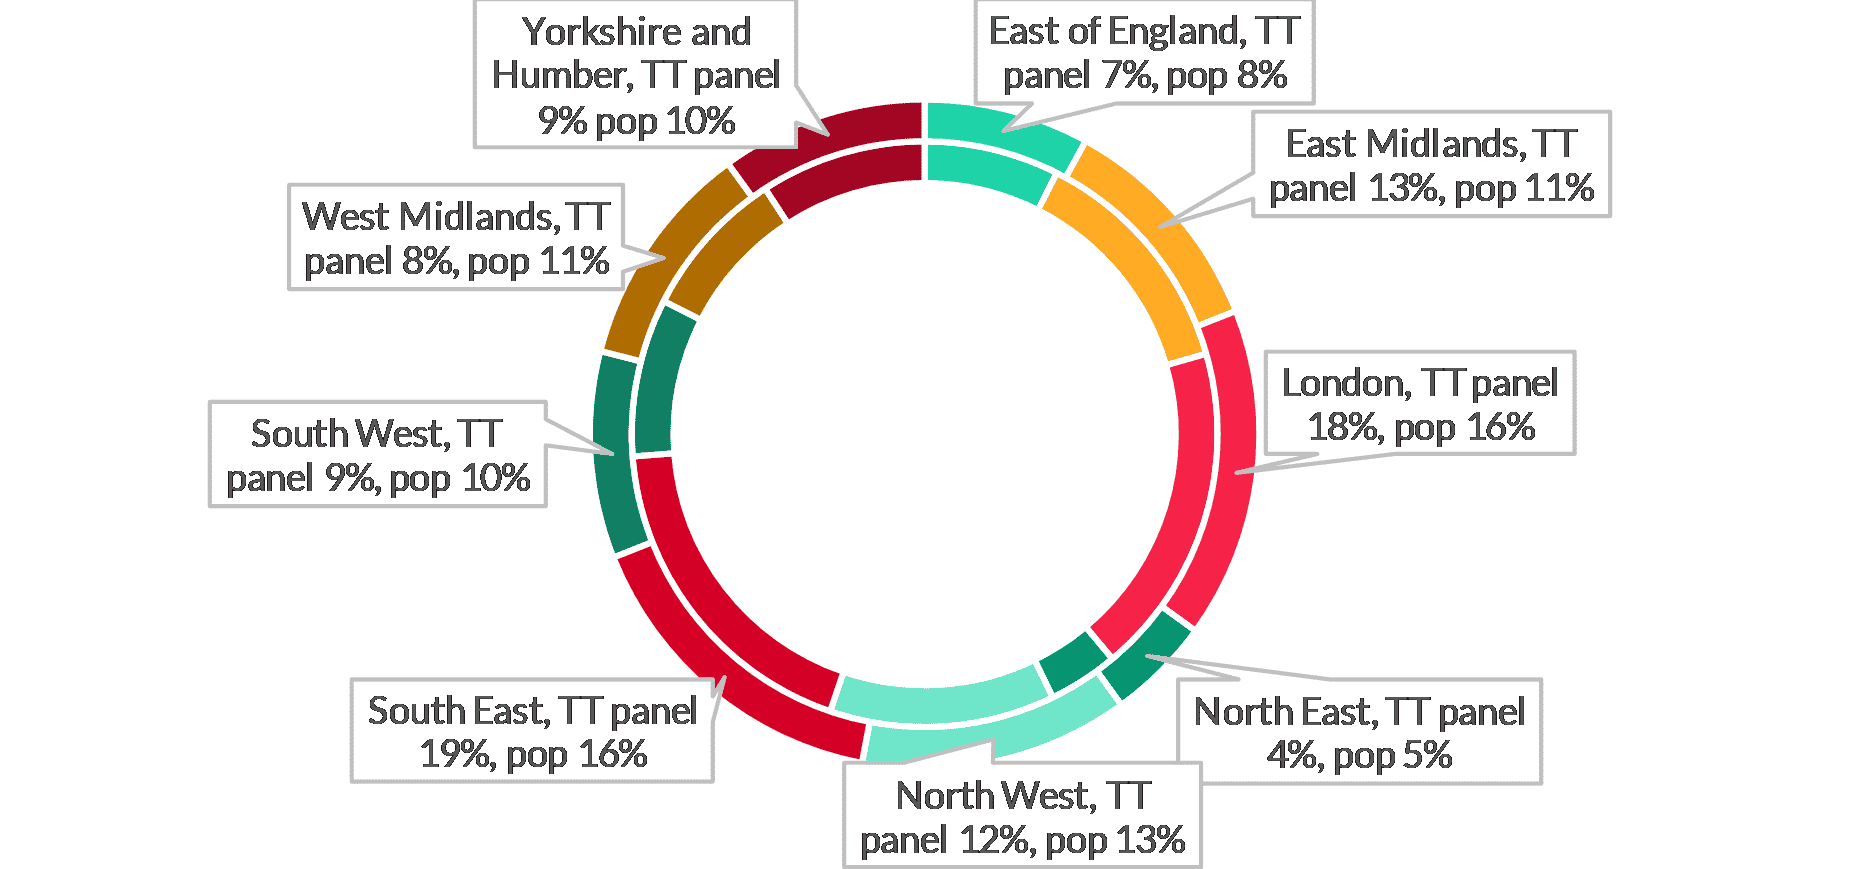
London, South-East and East Midlands teachers are a little over-represented
Teachers from the South-East, the East Midlands and London are currently over-represented in the panel. Thanks to those of you who have been promoting the app to colleagues in these regions. It is worth saying that no region is overly unrepresented, which is great.
Secondary school teachers are signing up faster than others
From the day we launched, we found that secondary school teachers have consistently signed up the fastest and special school teachers are currently under-represented. Secondary teachers make-up about half the teaching population, but they are 63% of our September 2018 sample. We now ask more questions especially designed for primary teachers, and we’d like to do this in the future for the special school sector to learn more about their work.
However, having a lot of secondary school teachers is pretty useful. We have a particular interest in how the working lives of teachers differ by subject specialism so need a particularly large sample to create this analysis.
Middle-aged male teachers like Teacher Tapp!
We have more male teachers than are in the population (32% in our sample versus 26% in the population) – this is largely because we are over-recruiting secondary teachers. Our teachers in their 20s are representative of the population but we have too few teachers in their 50s and too many in their 30s and 40s.
Too many leaders spoil the broth?
Teacher Tapp is extremely popular with those in senior leadership positions – they make up 29% of our panel versus 14% of the teacher population. Leaders are keen on thinking about their work, it seems! This is useful for us because there are many questions about schools that only leaders can answer.
Some Tappers are worth more than others!
In the full analysis we conduct on the panel, we create a set of post-stratification ‘weights’ that allow us to count the responses of some teachers more than others. We can only adjust for teacher characteristics where we know their proportions in the teacher population and re-weighting cannot be carried out on too many factors at once. At the moment we are re-weighting by:
- Gender
- Age category
- Senior leadership status
- Government Official Region
- Phase of schooling
- Private versus state-funded
To give an example of how these weights work, in a recent analysis we gave female primary classroom teachers in their 30s a weighting of 2.4x the value of a typical respondent. At the other end of the scale, male secondary senior leaders in their 30s were given a weighting of 0.2x the typical respondent.
This is the kind of analysis we carry out with the data behind the scenes to work out how best to represent the lives of real teachers in England.
The more teachers we recruit to the panel – particularly primary and special school teachers – the more interesting the research gets!